
OMNIRISK-IQ™ is a risk management solution unique to Omnia Nutriology® that models the cumulative probability or certainty of obtaining a specific yield in each zone of an OMNIZONE™ map. These probabilities are statistically derived from yield data obtained during previous seasons. For crops that are harvested with combines that are not equipped with yield monitoring technology, crop yield is estimated using NDVI based algorithms.
This model shows the producer for instance which yield has a 50% probability of realising in each zone. In the “Far below average” yield zone (red), the target according to the graph will be 3.24 t/ha, while for the “Average” zone (yellow) it will be 6.85 and for the “Far above average” zone (green)it will be 8.34 t/ha. The more information (seasons) used in this analysis, the more seasonal variation is taken into consideration to better quantify the risk. This information will assist farmers in preventing under-fertilization on high-potential areas and overfertilization on low-potential areas – in other words the right product, at the right time, in the right place, at the right rate. Several facets of the OmniRisklQ™ model, such as the gradient of the cumulative probability curves, are quantified and then deliberately monitored year after year to measure whether the applied management zones caused a real improvement and whether it was profitable.
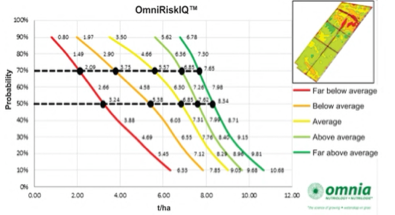
From this example, it is clear how the OmniZone™ solution can assist farmers by spatially identifying how and where yield risk is distributed over a certain farm. The OmniRisklQ™ model subsequently illustrates the various risks on the basis of yield and the probability of realising it in a specific management zone. Everything that happens in the planning phase is necessary, but it doesn’t take the prevailing economic aspects into consideration. This is surely one of the most determining factors in crop production. When the economic aspects are taken into consideration, the producer can calculate profitability per management zone and make final adjustments to the planning.
Two practices will be compared: variable fertilization (according to management zones) and conventional fertilization (based on average yield per farm). In this example, the average yield for maize over the last five years points to 6.85 t/ha. This will be the target yield for the conventional fertilization, whereas the target yield for the variable fertilization will be calculated by using OmniZone™ and OmniRisk-lQ™. These two management strategies for maize will be compared by using two grain prices and different input costs where applicable.
CONVENTIONAL FERTILIZATION
Figure 3 shows the margins for every management zone if all the management zones are fertilized using the same rate (conventional). The fertilizer rate was based on a yield of 6.85 t/ha across the entire farm. The total costs associated with this yield amounted to R14 245/ha or R2 080/tonne. The grain price, which was used to calculate income, was R2 400/tonne in the farmer’s pocket, in other words a SAFEX price of R2 650/tonne.
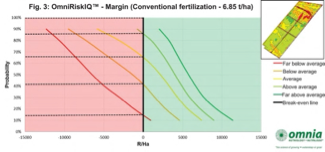
The black line on the graph represents the break-even point. The coloured lines represent the actual yields converted to income per hectare. Any part of a coloured line that lies to the left of the break-even point, means that losses will be incurred at those yields at the given input cost and grain price. Therefore, where the break-even line and the specific management zone cross, will be the minimum income that should be earned in that management zone to start making a profit. Where these two lines cross, a straight line can be drawn to the Y-axis to obtain a percentage. This percentage is an indication of the probability of making a profit in a specific zone, given the fixed input cost of R14 245/ha and a R2 400/tonne maize price. Figure 3 therefore shows the “Far below average” zone (red) has a 15% probability, the “Below average” zone (orange) has a 42% probability, the “Average” zone (yellow) has a 66% probability and the “Above and Far above” zones (light and dark green) have an 87% and 100% probability respectively to generate a profit at the specified input cost and grain price.
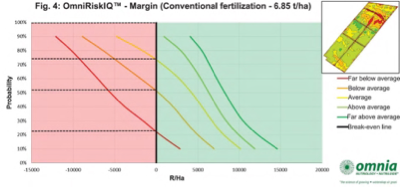
Figure 4 indicates the margins where the input costs were kept at the same level for the 6.85 t/ha fertilization, but where the grain price was calculated at R2 700 in the farmer’s pocket. The higher grain price increased the probability of making a profit in the “Far below average” zone (red) from 15% to 21%, the “Below average” zone (orange)from 42% to 52% and the probability of the “Average” zone (yellow)to show a profit moved up from 66% to 74%. The “Above average” and “Far above average” zones both showed a probability of 100% to generate a profit. The OmniRisk-lQ™ model also indicates that a R300/tonne increase in the grain price increased the profitability of the farm by between 6% and 10%. In this way, the target yield of 6.85 t/ha can also be adjusted in the OmniRisk-lQ™ model to suit the farmer’s risk appetite.
VARIABLE FERTILIZATION
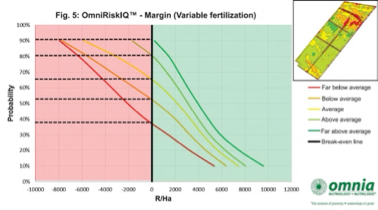
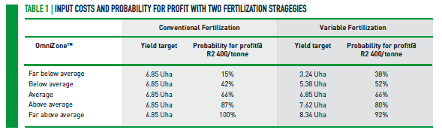
In the case of variable fertilization, the input cost is calculated per management zone. These management zones will be tested against a grain price of R2 400/tonne. Figure 5 again shows the margins that can be reached given specific input costs and a grain price of R2 400/ tonne in the farmer’s pocket. In this case, the probability of the lower yield zones to generate a profit is considerably higher than in the case of the conventional fertilizer approach. The reverse where the conventional approach stood a better chance to generate a profit, because the input costs were calculated according to the conventional approach at a much lower yield target of 6.85 t/ha, while the input costs for the variable fertilizer was calculated at yield targets of 7.62 t/ha and 8.34 t/ha (see Table 1). However, it is the lower yield zones that create a better opportunity for risk management, as these are the areas where greater financial losses are suffered. The higher yield zones are more of an opportunity for the producer than a risk.
By using different scenarios in the OmniRisk-lQ™ model, planning and risk management can be carried out more effectively. Every season should be carefully considered, especially under drought conditions. The risks and opportunities that the particular season might offer, should be accurately identified and managed to the benefit of the producer, according to his specific circumstances and risk appetite. Speak to your Omnia agronomist. Maybe your historic yield data can add real value to your business by making use of the OmniRisk-lQ™ model