SUPER5™
Remote sensing, especially satellite remote sensing, has become an integral and often prioritised part of precision farming. However, getting hold of relevant, contributing remotely sensed images and data in a specific, understandable, and affordable format is not always easy. The new Sentinel 2 satellite sensor with its red edge bandwidths, makes exciting new indicators (combinations of sensed absorbed and reflected wavelengths of light) available that adds hugely to interpreting specific types of plant stress.
Omnia Nutriology® and its remote sensing specialist partner, GeoTerra Image™, have developed a practical dashboard of five images and related pixel data to monitor plant stress during the growing season. It is readily available, easy to understand and quite affordable.
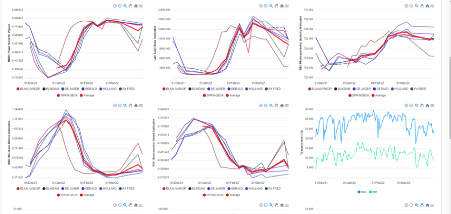
Figure 1 depicts an example of the SUPER-5™ satellite remote sensing monitoring solution report. The report is updated every 5 days and available via an online portal.
Each report contains five indicators:
- The well-known NDVI as plant vigour indicator;
- Photosynthetic activity indicator (chlorophyll based);
- An indicator of leaf area index;
- A moisture stress indicator; and
- An indicator of early senescence (any early stress).
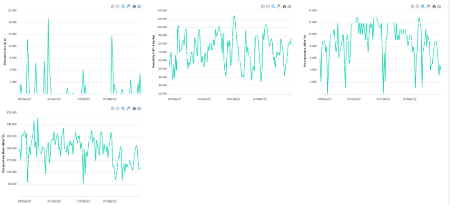
The online portal contains graphs showing the trends of all fields overlayed. This makes it possible to quickly identify fields that are falling behind the rest. The area’s climatic conditions are also included to correlate whether certain trends or changes are attributed to climatic conditions.


The SUPER-5™ monitoring solution also includes a SPAD, nitrogen deficiency and yield estimation for certain crops.
The SUPER-5™ offer is an excellent solution for monitoring fields and directing resources. Within a moment the trend analysis will indicate which zones/fields/ orchards pose a potential problem. Detail is then on hand to drill down to the actual probable cause by cross referencing indicators. For instance, the increase of the early senescence indicator with the increase of the moisture stress indicator indicates moisture stress, while a combination of decreased leaf area, photosynthetic activity and an increase in the early senescence indicator is a sure indication of the presence of disease stress. Historical data is always available to use in correlation studies and even to develop site specific algorithms.


